Production
| Current Wells | Production | |||||
| Location | Drilling | Testing | Reports | E-logs | Samples | |
| Pressure | Geochem | Temperature | Maturity | Lithostrat | Biostrat | |
Current well
| SABLE OFFSHORE ENERGY VENTURE 5 | |
|---|---|
| Unique Well ID: | 305 O32 44100 59300 |
| GSC#: | D353 |
| Spud Date: | 14-JUN-1998 |
| Area: | Scotian Shelf |
| Well Class: | DEVELOPMENT |
| Basin: | SCOTIAN BASIN |
| Gas: | GAS |
| Oil: | UNRATED |
| RT: | 51 M |
| WD: | 22 M |
| Field: | VENTURE |
| TD: | 6032 M |
| TVD: | 5365.5 M |
| Status: | P&A |
Yearly Production
Export to Excel | Print Version (Wide Table Format)| Year | Fluid | Yearly Volume | Cumulative Volume | Units | Days On | Average Daily Flow Rate Units Per Day | Data Source |
|---|---|---|---|---|---|---|---|
| 2000 | GAS | 124495.708 | 124495.708 | 1000 M3 | 96 | 1296.6 | CNSOPB |
| 2001 | GAS | 308710.77 | 433206.478 | 1000 M3 | 165.3 | 1867.3 | CNSOPB |
| 2002 | GAS | 286175.17 | 719381.648 | 1000 M3 | 243.9 | 1173.4 | CNSOPB |
| 2003 | GAS | 21514.41 | 740896.058 | 1000 M3 | 52 | 413.6 | CNSOPB |
| 2000 | WATER | 1697.689 | 1697.689 | M3 | 96 | 17.7 | CNSOPB |
| 2001 | WATER | 1509.26 | 3206.949 | M3 | 165.3 | 9.1 | CNSOPB |
| 2002 | WATER | 2451.82 | 5658.769 | M3 | 243.9 | 10.1 | CNSOPB |
| 2003 | WATER | 5852.28 | 11511.049 | M3 | 52 | 112.5 | CNSOPB |
Monthly Production
Export to Excel | Print Version (Wide Table Format)| Year | Fluid | Jan | Feb | Mar | Apr | May | Jun | Jul | Aug | Sep | Oct | Nov | Dec | Units | Data Source |
|---|---|---|---|---|---|---|---|---|---|---|---|---|---|---|---|
| 2000 | DAYS ON | 13.664 | 23.712 | 23.296 | 15.183 | 3.031 | .962 | 5.82 | 10.347 | DAYS | CNSOPB | ||||
| 2000 | GAS | 0 | 0 | 0 | 22145.863 | 40571.211 | 31195.443 | 18756.636 | 1547.144 | 529.4 | 3716.946 | 6033.065 | 0 | 1000 M3 | CNSOPB |
| 2000 | WATER | 0 | 0 | 0 | 416.007 | 457.177 | 307.187 | 131.564 | 13.444 | 7.869 | 156.736 | 207.705 | 0 | M3 | CNSOPB |
| 2001 | DAYS ON | 17.175 | 29.233 | 29.179 | 30.617 | 28.961 | 30.164 | DAYS | CNSOPB | ||||||
| 2001 | GAS | 0 | 0 | 0 | 0 | 0 | 0 | 25807.68 | 52568.48 | 49595.51 | 56554.75 | 59311.82 | 64872.53 | 1000 M3 | CNSOPB |
| 2001 | WATER | 0 | 0 | 0 | 0 | 0 | 0 | 397.5 | 75.92 | 134.88 | 157.52 | 279.34 | 464.1 | M3 | CNSOPB |
| 2002 | DAYS ON | 27.668 | 26.822 | 30.767 | 28.871 | 28.327 | 29.723 | 29.953 | 4.9 | .008 | 6.427 | 30.413 | DAYS | CNSOPB | |
| 2002 | GAS | 55397.21 | 46845.42 | 47889.81 | 38481.77 | 19679.28 | 14484.74 | 13417.77 | 1406.03 | 5.15 | 0 | 5452.43 | 43115.56 | 1000 M3 | CNSOPB |
| 2002 | WATER | 424.55 | 253.22 | 172.35 | 223 | 179.39 | 314.85 | 448.54 | 101.16 | .29 | 0 | 30.59 | 303.88 | M3 | CNSOPB |
| 2003 | DAYS ON | 29.513 | 16.396 | 2.724 | 3.387 | DAYS | CNSOPB | ||||||||
| 2003 | GAS | 13251.37 | 5041.16 | 0 | 1967.11 | 1254.77 | 0 | 0 | 0 | 0 | 0 | 0 | 0 | 1000 M3 | CNSOPB |
| 2003 | WATER | 2020.89 | 2899.7 | 0 | 49.98 | 881.71 | 0 | 0 | 0 | 0 | 0 | 0 | 0 | M3 | CNSOPB |
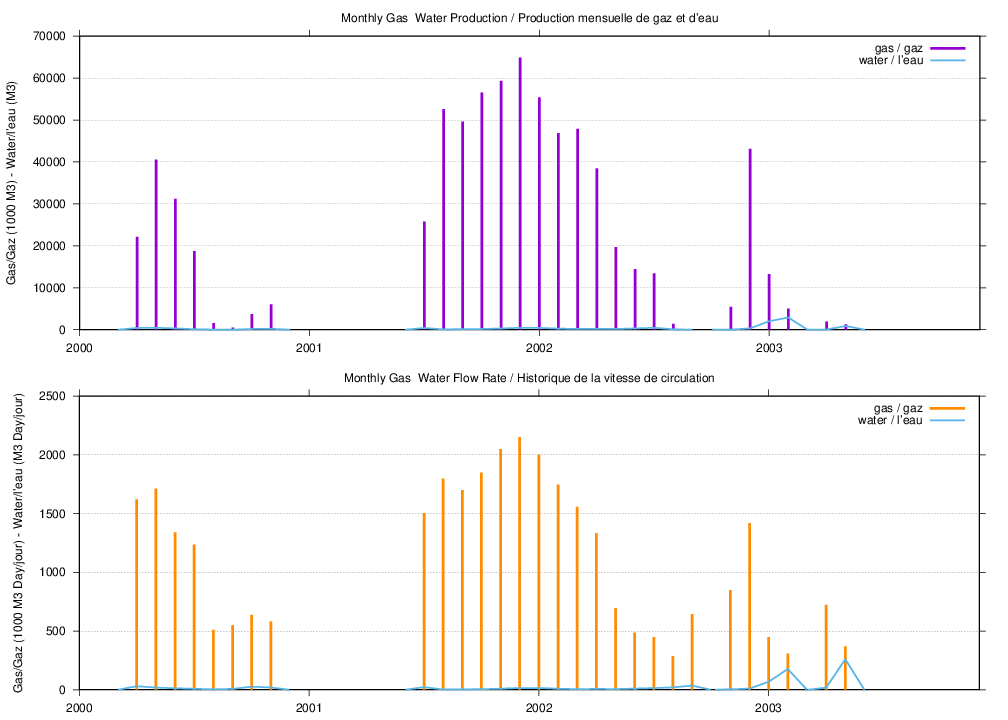
Gas & Water Production & Flow Rate History
Please note that the gas units are thousands of cubic metres while the water units are cubic metres
Download this plot in Postscript format. Click the plot for a large JPEG version.
